Best Coffee Cart Locations: Where to Set Up for Maximum Profit
Location selection determines coffee cart success more than any other factor, with prime spots generating $400-$600 daily while poor locations struggle to reach $100-$150 in sales. The difference isn’t just revenue, but business viability because coffee cart profitability depends on intercepting existing foot traffic during specific time windows rather than building destination demand like traditional cafes.
This comprehensive guide provides systematic approaches to identifying, analyzing, and securing profitable coffee cart locations that generate consistent revenue throughout the year.
Table of Contents
- Understanding Coffee Cart Location Economics
- Prime Coffee Cart Location Types
- Morning Commuter Locations
- Business District Strategies
- Campus and University Locations
- Medical Facility and Hospital Positioning
- Event and Festival Opportunities
- Location Analysis Methodology
- Traffic Studies and Data Collection
- Competition Assessment
- Seasonal Location Planning
- Common Location Mistakes
- Wrapping it up
Understanding Coffee Cart Location Economics
Coffee cart location economics differ fundamentally from general food cart operations due to concentrated demand periods, specific customer behaviors, and the nature of coffee as a habitual purchase rather than impulse food decision.
Revenue Concentration Patterns
Morning Dominance: Coffee cart revenue concentrates dramatically during morning hours, with 60-70% of daily sales occurring between 6:30-9:30 AM. This concentration means locations must provide adequate traffic during this specific window rather than throughout the day.
A location with 500 morning pedestrians generates more revenue than one with 1,000 all-day pedestrians if morning traffic includes coffee-seeking customers. This pattern differs from food carts where lunch periods dominate or event-based operations with variable timing.
Afternoon Secondary Window: The secondary revenue period (11:30 AM-2:00 PM) typically generates 20-30% of daily sales, serving customers seeking afternoon caffeine breaks rather than meal replacements. These customers often add pastries or snacks, boosting average transactions to $6-9 versus $4-6 for morning coffee-only purchases.
Evening and Weekend Variables: Evening service (4:00-7:00 PM) works only in specific locations including entertainment districts, college campuses during exam periods, or event venues. Weekend patterns vary dramatically by location type, with business districts dead while farmers markets and festivals thrive.
Customer Conversion Factors
Habitual Purchase Patterns: Coffee represents a habitual purchase for most consumers, with regular customers visiting 3-5 times weekly when convenient. This habit formation makes location consistency crucial because customers incorporate your cart into their routines rather than seeking it out.
Time Sensitivity: Coffee purchases are highly time-sensitive during morning commutes when customers have fixed schedules and limited flexibility. Service delays of 5+ minutes cause customer abandonment because missing transportation or arriving late to work outweighs coffee desire.
Convenience Threshold: Customers typically walk maximum 2-3 minutes from their primary path for convenient coffee, versus 5-10 minutes for destination cafes. This limited convenience radius means positioning must intercept existing traffic flows rather than expecting customers to deviate from routes.
Location Revenue Formula
Daily Revenue = (Morning Traffic × Morning Conversion) + (Afternoon Traffic × Afternoon Conversion) × Average Transaction – Location Costs
Example Calculation:
– Morning traffic: 400 pedestrians × 5% conversion × $5 average = $100
– Afternoon traffic: 200 pedestrians × 3% conversion × $7 average = $42
– Gross revenue: $142
– Location costs: $45 (permit, travel, allocated overhead)
– Net location profit: $97 daily or $24,250 annually (250 operating days)
This formula reveals why high morning conversion rates matter more than total daily traffic, and why location costs must remain proportional to revenue potential.
Prime Coffee Cart Location Types
Different location types serve distinct customer segments with unique behaviors, timing patterns, and revenue characteristics requiring tailored operational approaches.
Location Type Comparison Matrix
| Location Type | Peak Hours | Avg Transaction | Conversion Rate | Daily Revenue Potential | Seasonality |
|---|---|---|---|---|---|
| Business Districts | 7-9 AM | $4-6 | 4-6% | $300-500 | Low (10-15% variation) |
| College Campuses | 8-11 AM, 8-11 PM | $5-8 | 5-8% | $250-450 | High (50-70% summer drop) |
| Medical Facilities | 6-9 AM, 2-4 PM | $4-7 | 3-5% | $200-400 | Very Low (5-10% variation) |
| Transit Hubs | 6-9 AM, 4-7 PM | $4-5 | 3-5% | $250-450 | Low (15-20% variation) |
| Events/Festivals | Variable | $6-10 | 8-15% | $400-1,200 | Extreme (event-dependent) |
This matrix provides baseline expectations for different location types, enabling realistic revenue projections and strategic location portfolio development.
Morning Commuter Locations
Morning commuter locations represent the highest-value coffee cart opportunities due to concentrated demand, regular customer patterns, and minimal competition during early hours.
Transit Hub Opportunities
Train and Subway Stations: Major transit stations provide concentrated morning traffic with customers actively seeking coffee before or during commutes. Success requires understanding specific station layouts, platform locations, and boarding patterns.
Optimal Positioning: Position near ticket barriers or platform entrances where commuters pass naturally rather than requiring path deviation. Visibility from 50+ feet enables customers to spot your cart and make purchase decisions while approaching.
Timing Precision: Station traffic concentrates around train schedules, creating surge patterns every 10-30 minutes depending on service frequency. Understanding these patterns enables preparation before surges and efficiency during peak moments.
Service Speed Requirements: Transit customers have strict time constraints requiring 90-second to 2-minute service targets. Menu simplification, pre-ground coffee options, and efficient workflows become essential for conversion rate optimization.
Permit Challenges: Transit authorities typically require extensive permitting including background checks, insurance requirements, and competitive application processes. Application timelines often extend 3-6 months with fees ranging from $1,000-$5,000 annually.
Revenue Potential: Successful transit station operations generate $300-600 daily during 3-hour morning windows, with afternoon commute periods adding $100-200 depending on station traffic patterns and competition.
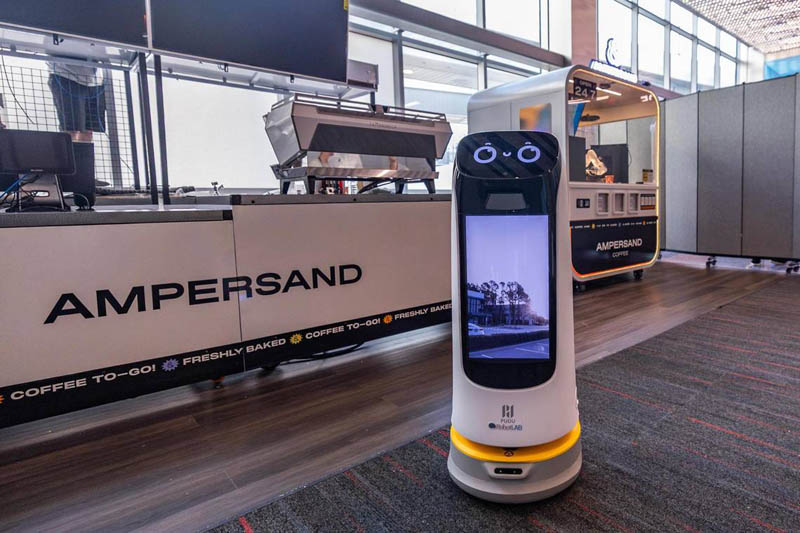
Ampersand Coffee
Dallas Fort Worth Airport
Park and Ride Facilities
Suburban Commuter Capture: Park and ride lots serve suburban commuters driving to transit connections, creating concentrated morning traffic without the permitting complexity of major transit stations.
Strategic Positioning: Position near lot exits where commuters walk toward transit platforms or bus stops. Early arrival (6:00-6:30 AM) captures earliest commuters and demonstrates reliability encouraging repeat business.
Customer Demographics: Suburban commuters typically have higher disposable incomes than urban transit users, supporting premium pricing for quality coffee ($5-7 range versus $4-5 at urban stations).
Lower Competition: Park and ride locations often lack established coffee options, enabling market leadership and customer loyalty development before competition arrives.
Permit Accessibility: Municipal or regional transit authorities often have simpler permitting than major transit stations, with lower fees ($200-1,000 annually) and less competitive application processes.
Office Park Entrances
Capturing Building Traffic: Position near office park main entrances or parking lot exits where employees pass during morning arrival periods (7:30-9:00 AM).
Relationship Building: Regular presence enables personal relationships with customers who appreciate consistency and recognition of their preferences and orders.
Corporate Partnership Potential: Successful operations often lead to formal agreements with property management including preferred vendor status, indoor positioning during poor weather, and corporate event catering opportunities.
Afternoon Extension: Office park locations support afternoon service (11:30 AM-2:00 PM) for lunch breaks and 2:30-4:00 PM for afternoon pick-me-ups, extending daily revenue beyond morning rush.
Business District Strategies
Business districts offer the highest concentration of coffee-consuming professionals, making them prime locations for coffee cart operations despite competitive pressure and permitting complexity.
Identifying Prime Business Locations
Office Worker Density Analysis: Research major employers within walking distance to estimate potential customer base. Buildings with 300+ employees create sufficient demand to support daily coffee cart operations.
Pedestrian Flow Mapping: Observe walking patterns between parking areas, transit stops, and office building entrances. Position at natural chokepoints where multiple paths converge rather than on single building approaches.
Competition Gap Identification: Map existing coffee options including shops, carts, and building cafeterias within 3-block radius. Identify gaps in service hours, pricing, or quality that your cart can fill.
Accessibility Assessment: Evaluate parking for cart setup, supply delivery access, and weather protection options. Locations requiring long walks from parking or lacking weather shelter create operational challenges affecting profitability.
Peak Hour Optimization
Morning Rush Strategies (7:00-9:30 AM): Optimize menu for speed with limited options emphasizing quick-service items. Pre-ground coffee for drip brewers, simplified espresso drinks, and grab-and-go pastries enable 2-minute service targets.
Preparation Timing: Arrive 30-45 minutes before peak to complete setup, equipment warmup, and initial preparation. Early arrival signals reliability to regular customers and enables optimal positioning before competitors.
Staffing Considerations: Two-person operations during peak hours double throughput capacity, enabling one person for order-taking and payment while another prepares drinks. This investment ($15-20/hour) often generates $100-150 additional revenue during peak periods.
Afternoon Service Strategy (11:30 AM-2:00 PM): Transition emphasis toward specialty drinks, cold beverages during warm weather, and food items for customers seeking light lunches. Slower pace enables more complex preparations and customer relationship building.
Business District Permit Strategies
Understanding Permit Types: Business districts typically require city vending permits, health department mobile vendor permits, and potentially business improvement district (BID) approvals affecting costs and application complexity.
Competitive Permit Processes: Popular business districts often have limited permits available through lottery systems, waiting lists, or competitive bidding requiring advance planning and sometimes substantial permit purchase costs.
Private Property Alternatives: Building owners and property management companies can grant private property permission avoiding some public permit requirements. Professional proposals emphasizing employee convenience and revenue sharing (10-15%) improve approval likelihood.
Permit Cost Management: Daily permits ($50-100) become expensive for regular operations, making monthly ($500-800) or annual permits ($3,000-8,000) more cost-effective despite higher upfront investment.
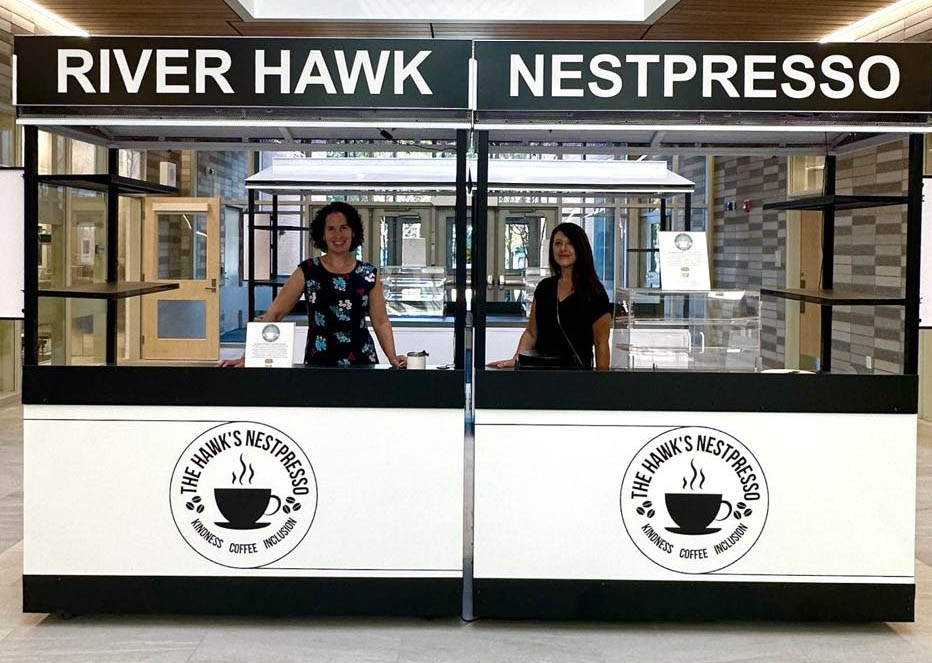
River Hawk Nestpresso
University of Massachusetts
Campus and University Locations
College and university campuses provide concentrated young adult populations with high coffee consumption rates, social media engagement, and willingness to try new vendors.
Campus Location Selection
High-Traffic Pathways: Identify main walking routes between dormitories, classroom buildings, libraries, and dining facilities. These paths concentrate foot traffic during class change periods (10-15 minute windows every hour).
Building Proximity Strategy: Position near library entrances (students studying), recreation centers (post-workout customers), or main classroom buildings (between-class coffee runs) rather than dormitory areas with dispersed traffic.
Social Hub Positioning: Campus social gathering spots including outdoor seating areas, green spaces, or building courtyards attract groups of students creating both immediate sales and word-of-mouth marketing through social dynamics.
Weather Shelter Considerations: Campus operations require weather protection strategies including covered walkways, building overhangs, or portable canopy systems because students remain active regardless of weather conditions.
Student Customer Behavior
Price Sensitivity Factors: Students typically prefer $4-6 price points over $7+ options, favoring value through larger sizes or simpler preparations over premium small drinks.
Frequency Over Amount: Students purchase coffee 4-7 times weekly at lower amounts rather than occasional premium purchases, making volume and customer retention more important than transaction maximization.
Social Influence Dynamics: Student customers often purchase in groups with peer influence affecting choices. Instagram-worthy presentations and social media engagement drive awareness and trial among student populations.
Late-Night Opportunities: Campuses support evening service (8:00 PM-midnight) during exam periods when students seek study fuel, creating revenue opportunities unavailable at most other location types.
Campus Permit and Partnership Strategies
University Vendor Agreements: Most campuses require formal vendor contracts rather than simple permits, involving multiple approval stages including administration, food service, and sometimes student government.
Application Timelines: Campus vendor applications typically require 2-4 months processing with annual renewal deadlines 6+ months before academic year starts. Missing deadlines often means waiting another full year for approval.
Revenue Sharing Arrangements: Universities typically require 10-20% of gross sales as “commission” for campus access. Some campuses mandate exclusive agreements or minimum operating schedules as approval conditions.
Student Employment Requirements: Many universities favor or require vendors who employ student workers, creating both labor benefits (flexible, reliable campus workers) and challenges (high turnover, training needs).
Managing Seasonal Volatility
Academic Year Patterns: Peak revenue occurs September through May (32-36 weeks) with dramatic drops during winter break (2-3 weeks), spring break (1 week), and summer sessions (8-12 weeks at 30-50% of regular revenue).
Financial Planning Requirements: Campus operators must generate and save sufficient revenue during peak periods to cover summer expenses or develop alternative summer locations replacing campus revenue.
Exam Period Maximization: Final exam periods offer revenue spikes 20-40% above normal through extended hours (6 AM-midnight), increased purchases (study fuel), and promotional “study specials” encouraging larger orders.
Break Period Strategies: Winter and spring breaks offer opportunities for deep cleaning, equipment maintenance, recipe testing, and menu development without revenue loss since campus populations disappear during these periods.
Medical Facility and Hospital Positioning
Healthcare facilities provide unique advantages including 24/7 operations, diverse customer base, and recession-resistant demand patterns making them valuable portfolio locations.
Hospital Location Strategies
Main Entrance Positioning: Hospital main entrances serve multiple customer types including staff arriving for shifts, visitors coming throughout the day, and patients seeking pre-appointment coffee.
Shift Change Targeting: Healthcare facilities have distinct shift changes (typically 6:30-7:30 AM, 2:30-3:30 PM, and 10:30-11:30 PM) creating concentrated traffic periods throughout the day unlike typical morning-only patterns.
Employee Parking Area Coverage: Position near employee parking lots or shuttle stops where staff walks daily. Healthcare workers often become extremely loyal customers purchasing 5+ times weekly once routines develop.
Visitor Service Opportunities: Visitors waiting for procedures or appointments provide steady mid-morning through afternoon traffic seeking coffee while waiting or before visiting patients.
Healthcare Customer Segmentation
Healthcare Professionals: Doctors, nurses, and medical staff represent highest-value customers with regular schedules, good incomes, and need for reliable caffeine during demanding shifts. This segment favors consistency, speed, and quality over price.
Administrative Staff: Hospital administrators, clerical workers, and support staff create steady 7:30-9:00 AM demand similar to business district patterns. These customers often have more flexible time enabling slightly slower service than healthcare professionals.
Visitors and Family: Visitors provide less predictable but steady demand throughout the day, typically less price-sensitive than regular customers and appreciating convenience during stressful hospital experiences.
Night Shift Workers: Overnight healthcare workers (10:00 PM-7:00 AM shifts) create unique late-night and early morning demand rarely serviced by other vendors, enabling potentially exclusive market access for operators willing to accommodate unusual hours.
Medical Facility Access and Permits
Property Management Relationships: Hospitals typically require vendor agreements with facilities management or food service departments rather than simple permits. Professional proposals emphasizing employee convenience and health-appropriate offerings improve approval likelihood.
Insurance and Background Requirements: Healthcare facilities often mandate higher insurance coverage ($2M general liability common), background checks, and health screening exceeding typical vendor requirements due to patient safety concerns.
Competition from Internal Services: Many hospitals have internal cafeterias or contracted food service creating competition concerns. Successful proposals emphasize differentiation through mobile convenience, hours complementing cafeteria schedules, and employee preference for variety.
Parking and Logistics: Hospital campuses often have complex parking and access restrictions requiring coordination with security and facilities departments. Understanding patient drop-off areas, loading zones, and staff access routes enables compliant and convenient positioning.
Event and Festival Opportunities
Events and festivals provide highest per-day revenue potential ($500-2,000) but require different strategies than regular location operations including advance planning, specialized equipment, and financial risk management.
Event Selection Criteria
Attendance Volume Assessment: Target events expecting 3,000-5,000+ attendees for adequate customer density. Smaller events rarely generate sufficient volume justifying setup time, travel costs, and opportunity costs from regular locations.
Event Duration Considerations: Multi-day events provide better return on investment through setup amortization and customer pattern learning. Single-day events require higher per-day revenue to justify participation.
Demographic Alignment: Research event demographics to ensure audience match with coffee consumption patterns. Morning community runs have excellent coffee demand, while late-afternoon beer festivals generate minimal coffee sales despite large crowds.
Vendor Competition Limits: Investigate vendor caps and coffee vendor exclusivity. Events limiting coffee vendors to 1-2 operators per 1,000 attendees create better revenue opportunities than oversaturated events with excessive competition.
Weather Protection: Evaluate event weather contingency plans and refund policies. Outdoor festivals without rain dates or refund provisions create financial risk when weather prevents operations.
Event Application Strategies
Advance Planning Requirements: Popular festivals often have application deadlines 6-12 months before events with jury processes selecting vendors based on quality, experience, and uniqueness.
Application Package Development: Professional applications include business licenses, insurance certificates, equipment photos, menu descriptions, and sometimes customer references or awards demonstrating operational quality.
Fee Structure Understanding: Event fees range from $100-2,000 depending on event size, exclusivity, and expected revenue potential. Some events charge flat fees while others require gross sales percentages (10-25%) plus flat fees.
Multi-Year Relationship Building: Securing event positions often becomes easier after successful initial participation. Excellent service, positive customer feedback, and professional operations lead to preferred vendor status and automatic renewal opportunities.
Event Operation Optimization
High-Volume Equipment: Events require equipment capable of sustained high-volume production including commercial-grade machines with large boilers, multiple grinders, and backup systems preventing revenue loss from equipment failures.
Staff Surge Management: Peak event periods require additional staff managing order queues, expediting service, and maintaining organization during surges. Two-person operations serve 40-60 customers hourly versus 20-30 for solo operators.
Menu Simplification: Event menus should emphasize quick-service items enabling 90-second to 2-minute service times. Limited specialty drinks, pre-batched cold brew, and simple flavoring options maintain speed during rushes.
Cash Flow Management: Events generate concentrated cash requiring secure storage, frequent banking, and sometimes armored transport for large festival weekends generating $3,000-10,000 in sales.
Location Analysis Methodology
Systematic location analysis transforms intuition into data-driven decisions, significantly improving success rates while reducing expensive mistakes from poor location investments.
Traffic Study Procedures
Observation Timing Strategy: Conduct counts during proposed operating hours across multiple days including weekdays and weekends capturing normal variation patterns. Single-day studies miss important pattern variations that affect revenue projections.
15-Minute Interval Counting: Count pedestrians in 15-minute intervals enabling precise peak hour identification and capacity planning. Hourly totals mask within-hour variation and sub-optimal positioning during actual peak periods.
Demographic Documentation: Note age ranges, group compositions, walking speeds, and apparent employment types providing insights into customer conversion likelihood and pricing tolerance beyond simple traffic counts.
Weather Variable Recording: Document weather conditions during studies because weather dramatically affects foot traffic (rain reduces traffic 30-50%) and coffee demand (cold increases demand 15-30%). Understanding weather correlations enables better forecasting.
Competition Observation: Monitor competitor performance including customer counts, wait times, and apparent satisfaction providing insights into demand levels, service gaps, and pricing benchmarks for location evaluation.
Converting Traffic to Revenue
Base Conversion Rates: Start with industry baseline conversion rates (business districts 4-6%, campuses 5-8%, transit 3-5%, events 8-15%) then adjust based on location-specific factors including competition density, positioning quality, and customer demographics.
Average Transaction Estimation: Research local coffee pricing to estimate transactions. Business districts typically $4-6, campuses $5-8, events $6-10 reflecting different customer demographics and purchase behaviors.
Operating Days Calculation: Account for weather closures, permit limitations, and seasonal variations reducing operating days below theoretical maximums. Most locations operate 200-250 days annually rather than 300-365 when including all constraints.
Revenue Projection Formula:
Daily Revenue = (Hourly Traffic × Operating Hours × Conversion Rate × Average Transaction) – Daily Costs
Example Projection:
– Morning traffic: 200 pedestrians/hour × 3 hours × 5% × $5 = $150
– Afternoon traffic: 100 pedestrians/hour × 2 hours × 3% × $6 = $36
– Daily costs: $55 (permit $35, fuel $10, allocated overhead $10)
– Net daily profit: $131 or $32,750 annually (250 days)
This projection provides baseline expectations for financial planning and location comparison.
Traffic Studies and Data Collection
Professional traffic data collection provides foundation for informed location decisions, preventing expensive mistakes from intuition-based location selection.
Manual Traffic Counting
Equipment and Tools: Digital counters ($15-30) enable accurate counting without distraction, though smartphone tally apps work adequately. Clipboards, weather-resistant paper, and timing devices complete basic toolkit.
Positioning Strategy: Stand where you can observe entire potential customer flow without obstructing or influencing pedestrian patterns. Positioning too close to proposed cart location may alter behavior compared to normal patterns.
Counting Protocols: Establish clear rules before starting – count individuals in groups separately, exclude obvious non-customers (delivery personnel, maintenance workers), and maintain consistent approach across all observation periods.
Environmental Documentation: Record temperature, precipitation, wind conditions, and any special circumstances (construction detours, special events, unusual closures) affecting normal patterns to enable future adjustment and interpretation.
Professional Traffic Studies
When to Hire Professionals: Consider professional studies ($500-2,000) for high-investment locations, competitive permit situations requiring data credibility, or multiple location comparisons benefiting from standardized methodology.
Professional Study Advantages: Professional studies provide automated counting eliminating human error, longer observation periods (days or weeks versus hours), credible documentation for permit applications, and detailed reporting with statistical analysis.
Data Types Collected: Professional studies often include directional flow analysis, pedestrian speed measurements, demographic estimation technology, and temporal pattern visualization unavailable through manual observation.
Interpreting Traffic Data
Peak Hour Identification: Identify specific hour(s) generating highest traffic concentrations for operation scheduling and capacity planning. Peak hours determine staffing needs, inventory requirements, and revenue optimization strategies.
Pattern Recognition: Look for traffic patterns including weekday versus weekend differences, weather sensitivity, seasonal variations, and special event impacts affecting operating strategy and financial planning.
Conversion Feasibility: Assess whether observed traffic includes likely coffee customers based on demographics, timing, and apparent purposes. Office workers during morning commutes convert well while tourists sightseeing midday convert poorly.
Competitor Impact Analysis: Evaluate how existing vendors affect traffic patterns and conversion rates. Established competitors may indicate strong demand or market saturation depending on their apparent success levels and market positioning.
Competition Assessment
Understanding competitive landscape enables strategic positioning, realistic revenue projections, and identification of underserved market opportunities.
Direct Coffee Competition
Existing Coffee Carts: Document other mobile coffee operations including schedules, locations, menu offerings, pricing, and apparent customer volumes. Direct mobile competitors affect conversion rates more than brick-and-mortar shops due to similar convenience positioning.
Brick-and-Mortar Shops: Map coffee shops within 3-block walking radius noting hours, pricing, seating capacity, and apparent customer demographics. Shops targeting different segments (laptop workers versus grab-and-go) affect cart operations differently than direct competitors.
Seasonal Vendor Competition: Identify seasonal vendors (farmers market carts, festival operators) who may appear during specific periods affecting your established business when they arrive.
Corporate Food Service: Research whether nearby buildings have internal cafeterias, subsidized coffee service, or contracted vendors affecting employee demand for outside options.
Competition Gap Analysis
Service Hour Gaps: Identify times when demand exists but supply is limited including early morning (before shops open), mid-afternoon (after lunch rush), or evening (when shops close).
Pricing Position Opportunities: Analyze pricing distribution to identify gaps. Market may support premium positioning ($6-8 range) if only budget options exist, or value positioning ($3-5) if only expensive shops operate nearby.
Menu and Quality Differentiation: Assess whether existing options emphasize particular styles (traditional drip versus espresso-focused, commercial versus craft) creating opportunities for differentiation through quality, preparation methods, or ingredient sourcing.
Customer Service Gaps: Observe competitor service quality, speed, and customer interaction identifying opportunities through superior service, personalization, or efficiency improvements.
Seasonal Location Planning
Coffee cart locations require seasonal adaptations as weather, customer patterns, and foot traffic change throughout the year.
Spring Transition Strategy
Weather Improvement Timing: Begin transitioning to outdoor locations as weather consistently improves (typically April-May depending on region). Monitor 10-day forecasts planning location shifts during stable weather windows.
New Location Testing: Spring provides optimal timing for testing new outdoor locations with improving weather, increasing foot traffic, and reduced weather-related closure risks compared to winter testing.
Equipment Maintenance: Use early spring for equipment servicing, cart refurbishment, and system upgrades before peak summer season when downtime costs increase dramatically.
Menu Transitions: Gradually introduce cold beverage options, lighter roasts, and iced drink promotions as temperatures rise and customer preferences shift toward refreshing rather than warming drinks.
Summer Peak Season Management
Extended Hours Exploitation: Longer daylight and increased outdoor activity enable extended operating hours capturing more revenue from each location. Many summer operations extend to 8-9 PM at appropriate locations.
Tourist Location Addition: Add tourist-focused locations during peak visitor seasons including beach areas, tourist attractions, and entertainment districts that generate minimal winter traffic.
Event Circuit Participation: Summer festival and event seasons provide highest revenue-per-day opportunities. Successful operators balance regular locations with lucrative event participation.
Heat Management Operations: Implement operational adaptations for hot weather including equipment cooling, supply chain modifications for heat-sensitive ingredients, and menu emphasis on cold beverage options.
Fall Schedule Adjustments
Academic Calendar Alignment: Campus locations experience surge returns as students return for fall semester. Ensure permits, supplies, and staffing are ready for September traffic increases.
Reduced Hours Implementation: Shorter daylight and cooler temperatures reduce outdoor evening traffic, making hour reductions appropriate for most locations.
Holiday Market Preparation: Research and apply for holiday markets, craft fairs, and seasonal events providing revenue opportunities during traditionally slower late November through December periods.
Equipment Winterization: Begin equipment protection preparations including freeze protection systems, winter storage planning, and cold weather operational procedures before temperature drops affect equipment.
Winter Survival Strategies
Indoor Location Priority: Shift focus toward indoor alternatives including covered markets, mall food courts, office building lobbies, and transit station interiors providing weather protection.
Reduced Schedule Planning: Many operators reduce to 3-4 days weekly during harsh winter months, focusing on highest-revenue locations while reducing exposure to weather-related closures and reduced traffic.
Alternative Revenue Development: Use winter downtime for developing catering services, corporate contracts, subscription programs, or wholesale coffee sales providing revenue streams less dependent on weather and foot traffic.
Equipment Maintenance Period: Schedule major equipment maintenance, cart modifications, and deep cleaning during slow winter periods when revenue loss is minimized.
Common Location Mistakes
Learning from typical location errors prevents expensive mistakes that could be avoided through proper planning and analysis.
Research and Analysis Failures
Insufficient Traffic Studies: Many operators choose locations based on casual observation or single-day studies missing important pattern variations that affect actual revenue potential.
Consequence: Revenue projections 30-50% higher than reality leading to financial struggles and potential business failure.
Solution: Conduct minimum 3-day traffic studies during different weather conditions and times documenting patterns, demographics, and competitor performance.
Ignoring Time Concentration: Selecting locations with strong all-day traffic but weak morning concentration results in disappointing revenue because coffee demand concentrates during specific windows.
Consequence: Locations appearing busy may generate insufficient morning revenue when 60-70% of daily coffee sales must occur.
Solution: Focus traffic analysis on morning periods (6:30-9:30 AM) rather than all-day totals, ensuring adequate traffic during actual coffee purchasing windows.
Competition Underestimation: Failing to assess existing coffee options leads to market saturation problems where multiple vendors chase limited customers.
Consequence: Conversion rates and average transactions well below projections due to divided customer base.
Solution: Map all coffee options within 3-block radius and realistically assess whether market can support additional vendor or whether positioning must emphasize differentiation.
Operational and Access Issues
Permit Complexity Surprises: Underestimating permit requirements, costs, or timelines causes delayed launches, unexpected expenses, or inability to operate at chosen locations.
Consequence: Delayed revenue start dates, wasted preparation expenses, or lost opportunities to competitors securing permits first.
Solution: Research all permit requirements before equipment purchases or major investments, building timelines and budgets assuming 8-12 week approval processes.
Inadequate Parking and Access: Choosing locations without considering parking for setup, supply delivery access, or daily operational logistics creates ongoing operational challenges.
Consequence: Additional time costs, parking violations and fines, or inability to efficiently restock during service periods.
Solution: Visit potential locations during proposed operating hours assessing parking availability, loading zones, access restrictions, and distance from parking to cart positioning.
Weather Exposure Neglect: Selecting outdoor locations without weather protection planning results in frequent closures, equipment damage, and customer service inconsistency.
Consequence: Revenue loss from weather closures (20-30% of potential operating days in many climates), equipment repair costs, and customer loyalty erosion from unreliable service.
Solution: Evaluate weather protection options including building overhangs, permanent canopies, or portable shelter systems before committing to exposed outdoor locations.
Financial Planning Errors
Unrealistic Revenue Projections: Overly optimistic sales forecasts based on best-case scenarios rather than conservative analysis lead to financial difficulties when actual performance falls short.
Consequence: Cash flow problems, inability to cover operating expenses, or business failure when revenue doesn’t meet projections.
Solution: Use conservative conversion rates (reduce estimated rates by 20%), account for weather closures and seasonal variations, and plan for 3-6 month ramp-up period before achieving steady-state revenue.
Location Cost Underestimation: Failing to account for all location-related costs including daily permits, parking fees, fuel, and increased travel time makes seemingly profitable locations actually unprofitable.
Consequence: Locations that appear profitable on gross revenue actually lose money when all costs are properly allocated.
Solution: Calculate true location profitability including all direct costs (permits, fuel, parking) and allocated overhead (equipment depreciation, insurance, proportional labor) before committing to regular service.
Seasonal Cash Flow Mismanagement: Not planning for predictable seasonal revenue drops leads to cash shortages during slow periods despite strong peak-season performance.
Consequence: Emergency borrowing, bill payment delays, or business closure during seasonal downturns.
Solution: Build cash reserves during peak seasons equal to 3-6 months operating expenses, develop alternative winter revenue streams, and plan budgets assuming seasonal revenue patterns rather than year-round averages.
Wrapping it up
Coffee cart location success requires systematic analysis, strategic planning, and ongoing optimization rather than luck or intuition. The most successful operators combine quantitative analysis through traffic studies and revenue projections with qualitative assessment of customer behaviors, competitive positioning, and operational feasibility.
Key Location Success Principles
Morning Concentration Focus: Prioritize locations with strong morning traffic (6:30-9:30 AM) when coffee demand concentrates, rather than locations with higher all-day traffic but weak morning periods.
Systematic Analysis Methods: Use structured traffic studies, demographic research, and competition assessment rather than casual observation preventing expensive mistakes from poor location selection.
Portfolio Diversification: Develop 3-5 locations with different customer types, timing patterns, and seasonal characteristics reducing risk while maximizing revenue opportunities throughout the year.
Permit Planning: Research and plan for permit requirements including timelines (8-12 weeks), costs ($1,000-$8,000 annually), and restrictions before investing time and money in location development.
Financial Discipline: Calculate true location profitability including all costs and seasonal variations using conservative projections rather than optimistic best-case scenarios.
Operational Feasibility: Assess parking access, weather protection, supply delivery logistics, and travel time between locations ensuring operational viability supports financial potential.
Customer Relationship Building: Location consistency builds customer routines and loyalty generating stable revenue through repeat business rather than constant new customer acquisition.
Your Location Success Action Plan
Begin with systematic research identifying 8-10 potential locations meeting basic criteria for coffee cart operations including adequate morning traffic, permit feasibility, and operational accessibility. Conduct professional traffic studies documenting pedestrian patterns, customer demographics, and competitor performance during proposed operating hours.
Analyze data using conservative conversion rates and realistic cost projections to identify locations offering best profitability potential. Factor in permit timelines, seasonal patterns, and portfolio diversification needs when prioritizing location development sequence.
Start with single location operations perfecting procedures, building customer relationships, and establishing financial stability before expanding to additional locations. Most successful operators spend 6-12 months optimizing initial location before portfolio expansion.
Develop location portfolio gradually adding complementary locations that serve different customer segments, operate during different time periods, or provide seasonal balance reducing overall business risk while increasing revenue potential.
Monitor performance continuously tracking location-specific metrics including revenue per hour, customer counts, conversion rates, and profitability after all costs. Use data to optimize existing locations, identify expansion opportunities, and eliminate underperforming locations that don’t justify ongoing investment.
Most importantly, remember that location excellence comes from consistent execution of systematic analysis rather than intuitive location selection. Successful operators invest time in research and planning preventing expensive mistakes while identifying opportunities that competitors overlook through casual analysis.
Ready to develop your complete coffee cart business plan? Explore our comprehensive guides on coffee cart startup costs, essential equipment selection, and menu development strategies for complete planning resources.
What you can read next

