Food Cart Business Locations
Choosing the right location for your food cart can make or break your business. When it comes to mobile vending, the mantra “location, location, location” couldn’t be more true. High foot traffic isn’t just important, it’s essential for generating sales and building a loyal customer base.
Studies show that businesses in high-traffic areas see 30% to 50% more sales compared to those in low-traffic zones. However, finding these profitable spots requires more than just looking for crowds. Successful food cart operators use systematic location analysis, traffic studies, and strategic research to secure spots that generate consistent revenue year-round.
This comprehensive guide covers the best location types for food carts and provides the analytical tools you need to identify, evaluate, and secure the most profitable spots for your mobile food business.
Table of Contents
- Why Foot Traffic Is King
- Office Parks: Lunchtime Goldmines
- Bus and Train Stations: Catering to Commuters
- Public Streets: High Visibility, High Demand
- Sports Venues: Fans + Food = Success
- College Campuses: A Hungry, Loyal Crowd
- Festivals and Markets: Seasonal Opportunities
- Location Analysis and Traffic Studies
- Demographic Research for Location Success
- Competition Analysis and Market Gaps
- Permits and Legal Considerations
- Multi-Location Strategy
- Common Location Mistakes to Avoid
- Maximize Your Success: Choosing the Right Cart for the Right Spot
- Wrapping it up
Why Foot Traffic Is King
The more people that pass by your cart, the greater your chances of making a sale—it’s as simple as that. Customers often make spontaneous food purchases, especially when they’re on the go. This makes locations like train stations, busy streets, and sports venues prime real estate for food vendors.
However, foot traffic volume alone doesn’t guarantee success. The key is understanding location economics: matching the right customer demographics with your menu offerings while ensuring adequate profit margins after location-related expenses.
Location Economics Formula
Daily Revenue = Foot Traffic × Conversion Rate × Average Transaction
For example:
- Location with 1,000 daily pedestrians × 3% conversion rate × $8.50 average transaction = $255 daily revenue
- Location with 600 pedestrians × 5% conversion rate × $10.25 average transaction = $307 daily revenue
The second location generates more revenue despite lower foot traffic because the customers are better targeted and willing to spend more.
Understanding these fundamentals helps you evaluate locations based on profitability rather than just crowd size. Let’s explore the best location types and how to analyze each one effectively.
Office Parks: Lunchtime Goldmines
Office parks are bustling hubs of activity during weekday mornings and lunch breaks. Employees often look for convenient, quick, and delicious options nearby. Position your food cart in a popular office park, and you could become the go-to spot for breakfast burritos, sandwiches, or coffee.
Why Office Parks Work:
- A steady flow of hungry professionals, especially between 8-10 AM and 12-2 PM
- High potential for repeat customers who crave convenience and consistency
- Low competition from traditional restaurants in many office park locations
- Customers with disposable income and time constraints that favor quick service
Office Park Location Analysis
Traffic Pattern Research: Office parks have highly predictable traffic patterns that make forecasting reliable. Conduct traffic counts during these key periods:
- Morning rush (7:30-9:30 AM): Coffee and breakfast items
- Lunch peak (11:30 AM-1:30 PM): Main revenue opportunity
- Afternoon break (2:30-4:00 PM): Snacks and beverages
Target Customer Profile: Office workers typically earn $35,000-$80,000 annually and value convenience over price. They’re willing to pay $8-12 for lunch and often become loyal customers when service is consistent and quick.
Revenue Potential: Successful office park operations generate $300-600 daily with conversion rates of 4-6% during peak hours. A complex with 1,000 employees can support 25-60 daily customers with proper positioning and menu selection.
Location Requirements:
- Visible from main pedestrian walkways
- Accessible parking for cart setup and supply delivery
- Permission from property management (often requires insurance and revenue sharing)
- Weather protection considerations for year-round operation
Menu Optimization for Office Parks:
Focus on items that travel well and can be eaten at desks:
- Grab-and-go sandwiches and wraps
- Coffee and specialty beverages
- Salads in portable containers
- Healthy snacks and protein options
Securing Office Park Locations
Property Management Approach: Contact property managers rather than individual businesses. Emphasize benefits including employee convenience, foot traffic generation, and potential revenue sharing (typically 10-15% of gross sales).
Proposal Elements: Include liability insurance certificates, business licenses, health department permits, and references from other successful locations. Professional presentations increase approval likelihood significantly.
Pro Tip: Offer pre-order options via an app or social media to maximize your lunch rush efficiency and build customer loyalty.
Bus and Train Stations: Catering to Commuters
Transit hubs are prime locations for food carts. With thousands of commuters and tourists passing through every day, your cart can serve as a quick stop for coffee, snacks, or light meals.
Why Transit Hubs Work:
- Busy commuters often grab food on the go
- Tourists looking for local eats are likely to stop for a bite
- Constant flow of people at peak hours (6-9 AM, 4-7 PM)
- Captive audience waiting for transportation
Transit Hub Location Analysis
Peak Hour Traffic Studies: Transit locations have distinct rush hour patterns that require specific analysis:
- Morning commute (6:00-9:00 AM): Coffee, pastries, breakfast sandwiches
- Evening commute (4:00-7:00 PM): Snacks, beverages, light dinner options
- Midday traffic (10:00 AM-3:00 PM): Tourist and leisure travelers
- Weekend patterns: Different flow with more tourists and leisure travelers
Customer Segmentation: Transit hubs serve two distinct customer types:
- Commuters: Regular customers with predictable schedules and preferences
- Tourists: One-time customers willing to try local specialties and pay premium prices
Conversion Rate Factors: Transit location success depends on convenience and speed. Customers typically have 2-5 minutes before departure, making quick service essential for conversion rates of 3-5%.
Revenue Optimization: Successful transit operations focus on high-margin, grab-and-go items. Average transactions range from $4-8, but volume can reach 200-400 daily customers at busy stations.
Transit Hub Operational Considerations
Permit Requirements: Transit authorities typically require special permits, insurance coverage, and background checks. Application processes can take 3-6 months with fees ranging from $500-3,000 annually.
Space Limitations: Most transit locations have strict size restrictions and designated vendor areas. Cart dimensions and setup procedures must comply with safety and accessibility requirements.
Security and Safety: Transit hubs have enhanced security requirements including equipment screening, staff background checks, and emergency procedures training.
Pro Tip: Add grab-and-go options like packaged sandwiches or wraps for commuters in a hurry. Pre-made items improve service speed during rush periods.
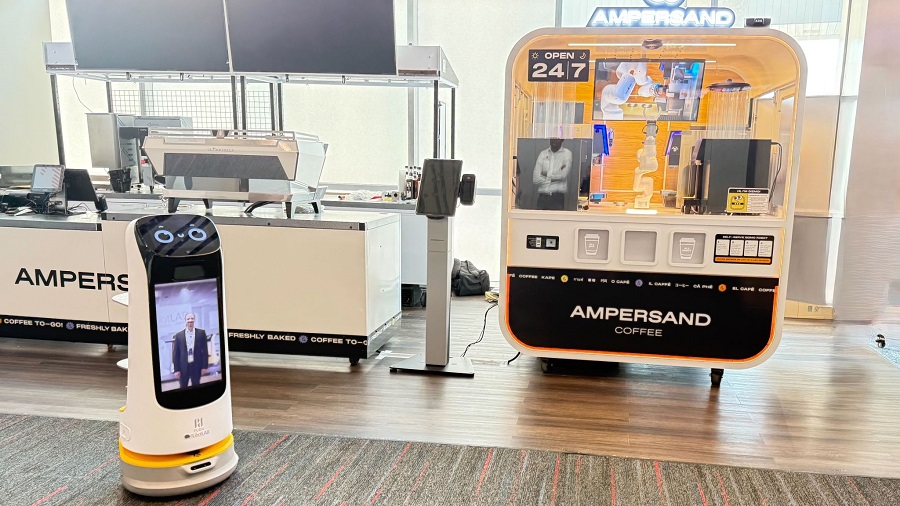
Ampersand Coffee
Dallas Fort Worth Airport
Public Streets: High Visibility, High Demand
Bustling streets in city centers are among the best locations for food carts—if you can secure the necessary permits. Popular areas with lots of pedestrian traffic, such as near parks, shopping districts, or downtown hubs, can drive huge volumes of sales.
Why Public Streets Work:
- Pedestrians are more likely to stop and grab a snack or drink
- The visibility of your cart can lead to spontaneous purchases
- Opportunity to cater to a mix of locals, tourists, and workers
- No property owner revenue sharing requirements
Public Street Location Analysis
Pedestrian Traffic Studies: Public streets require comprehensive traffic analysis across different times and conditions:
- Weekday business hours (9:00 AM-5:00 PM): Office worker foot traffic
- Evening entertainment (6:00 PM-10:00 PM): Restaurant and bar districts
- Weekend activity (10:00 AM-8:00 PM): Shopping and leisure traffic
- Event-driven traffic: Concerts, festivals, sports games
Location Quality Assessment: Not all busy streets are profitable for food carts. Evaluate these factors:
- Walking speed: Slow-moving pedestrians (tourists, shoppers) convert better than fast-moving commuters
- Group composition: Families and friends are more likely to stop than solo commuters
- Adjacent businesses: Complement nearby restaurants or fill gaps in food options
- Visibility and accessibility: Corner locations with clear sightlines perform best
Competition Density: Public streets often have heavy competition from restaurants, other food carts, and street vendors. Success requires differentiation through unique menu items, superior service, or strategic timing.
Street Vending Permit Process
Municipal Requirements: Street vending permits vary dramatically by city:
- New York City: Extremely limited permits selling for $150,000+ on secondary market
- Los Angeles: Annual permits ranging from $1,000-3,000 with reasonable availability
- Chicago: Monthly permits from $200-800 with moderate competition
- Smaller cities: Often $25-100 daily permits with easier access
Zoning Compliance: Research zoning maps to identify legal vending areas. Many cities restrict food carts in certain zones to protect restaurants or maintain neighborhood character.
Health Department Coordination: Public street vending requires mobile vendor health permits, regular inspections, and commissary kitchen agreements. Compliance costs range from $300-800 annually.
Pro Tip: Eye-catching signage and vibrant branding can help attract attention in crowded urban areas. Professional cart design and clear menu displays significantly improve conversion rates.
Sports Venues: Fans + Food = Success
Stadiums and sports venues are treasure troves for food vendors. Hungry fans looking to grab a quick meal before or during the game are a captive audience with high spending willingness.
Why Sports Venues Work:
- Large crowds and extended events mean high sales potential
- Fans are often willing to pay a premium for convenient, tasty food
- Seasonal events, concerts, and sports tournaments keep the flow of customers steady
- Celebratory atmosphere increases spending and trial of new foods
Sports Venue Location Analysis
Event-Based Revenue Planning: Sports venues require different analysis because revenue concentrates around specific events:
- Game day traffic: 10,000-80,000+ potential customers over 4-6 hour periods
- Pre-game rush: 2-3 hours before event start with peak traffic 1 hour before
- Post-game opportunity: 30-45 minutes after events for hungry fans
- Season scheduling: Revenue concentrated in specific months depending on sport
Customer Spending Behavior: Sports fans exhibit different purchasing patterns:
- Higher transaction amounts: $12-18 average compared to $8-12 at other locations
- Group purchasing: Families and friend groups increase order sizes
- Alcohol complement: Food purchases often accompany alcohol consumption
- Impulse buying: Celebratory atmosphere encourages trying new items
Location Competition: Sports venues often limit vendor numbers, creating competitive application processes:
- Exclusive partnerships: Some venues grant exclusive rights to single operators
- Revenue sharing: Typically 15-25% of gross sales to venue
- Equipment requirements: High-volume capacity needed for crowd surges
- Insurance mandates: Higher coverage limits due to large gatherings
Sports Venue Application Strategy
Advance Planning: Most sports venues require applications 6-12 months before season starts. Popular venues may have waiting lists or competitive bidding processes.
Volume Capacity: Demonstrate ability to serve 500-1,000+ customers during 2-3 hour peak periods. This requires specialized equipment, additional staff, and inventory planning.
Menu Specialization: Sports venues favor items that match the atmosphere:
- Gourmet hot dogs and sausages
- Specialty nachos and loaded fries
- Local/regional specialty items
- Easy-to-eat handheld foods
Pro Tip: Offer items that are easy to eat on the go, like gourmet hot dogs, nachos, or specialty fries. Focus on items that can be prepared quickly during rush periods.
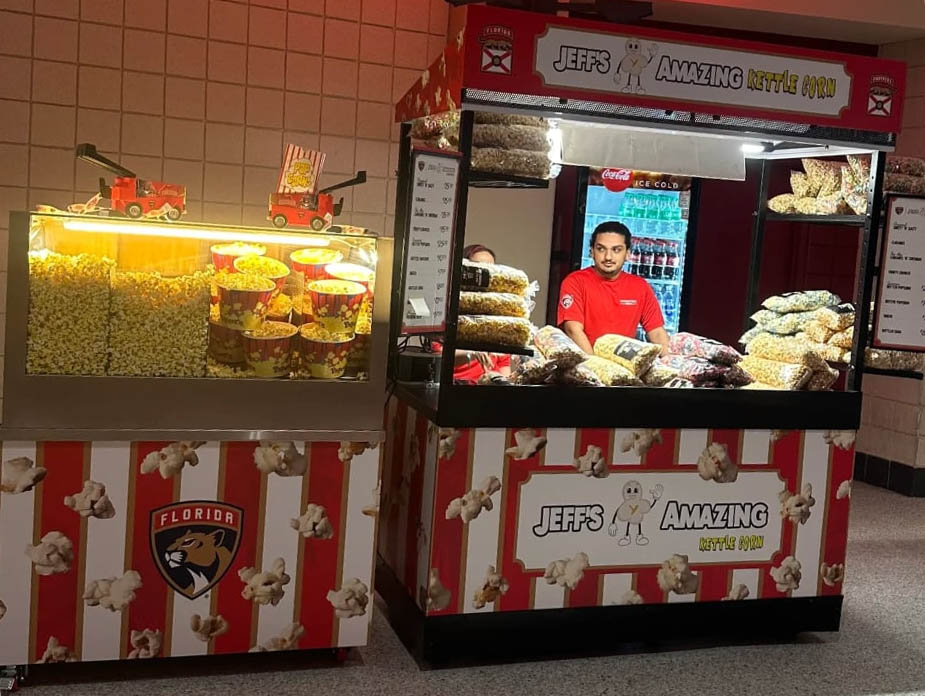
Jeff’s Amazing Kettle Corn
Amerant Bank Arena
College Campuses: A Hungry, Loyal Crowd
College campuses are hotspots for food carts, especially when you position yourself near dorms, libraries, or lecture halls. Students appreciate affordable, quick meals that fit their busy schedules and limited budgets.
Why College Campuses Work:
- Consistent daily traffic from students and staff
- Opportunity to build a loyal customer base over semesters
- Demand for budget-friendly options like tacos, burritos, or bubble tea
- Extended operating hours potential with late-night demand
Campus Location Analysis
Student Traffic Patterns: Campus locations have unique traffic flows based on academic schedules:
- Class change periods: 15-minute rushes between class hours
- Lunch peak: 11:30 AM-1:30 PM with heavy concentration
- Late night service: 8:00 PM-12:00 AM for studying students
- Weekend activity: Different patterns focused on social areas
Seasonal Revenue Fluctuations: Campus operations face dramatic seasonal changes:
- Peak semester: September-May with consistent high traffic
- Summer sessions: 50-70% revenue reduction with limited summer enrollment
- Break periods: Complete shutdown during winter break, spring break
- Final exams: Increased late-night service opportunities
Student Spending Behavior: College students have unique purchasing patterns:
- Price sensitivity: Average transactions $5-8, preferring value options
- Frequency over amount: Multiple small purchases rather than large orders
- Social influence: Students often purchase in groups following friends’ choices
- Dietary preferences: Higher demand for vegetarian, vegan, and healthy options
Campus Partnership Development
University Agreements: Most campuses require formal vendor agreements rather than simple permits:
- Application process: Often involves multiple departments and 2-4 month approval
- Exclusive territories: Universities may grant specific areas to single operators
- Revenue sharing: Typically 10-20% of gross sales to university
- Student employment: Preference for vendors who hire student workers
Location Selection Strategy: Campus success depends on strategic positioning:
- High-traffic walkways: Between dormitories and academic buildings
- Library proximity: Students studying need convenient food access
- Recreation centers: Post-workout customers seeking healthy options
- Event venues: Concerts, sports, and activities create surge opportunities
Menu Development for Students:
- Affordable pricing: Keep most items under $8 to match student budgets
- Customizable options: Build-your-own concepts appeal to individual preferences
- Healthy alternatives: Accommodate health-conscious and dietary restriction needs
- Late-night appropriate: Items suitable for studying fuel and midnight cravings
Pro Tip: Offer vegetarian or vegan options to appeal to diverse student preferences. Many campuses have high percentages of students following alternative diets.
Festivals and Markets: Seasonal Opportunities
Pop-up markets, street fairs, and music festivals bring together large crowds looking for unique food experiences. Setting up your cart at these events can lead to a surge in sales and visibility for your brand.
Why Festivals Work:
- People are already in a buying mindset at these events
- Opportunity to showcase specialty or signature menu items
- Great way to market your business to new customers
- Higher pricing tolerance due to entertainment atmosphere
Festival and Market Analysis
Event Selection Criteria: Not all festivals generate profitable opportunities:
- Attendance numbers: Target events with 5,000+ expected attendance
- Event duration: Multi-day events provide better revenue potential
- Demographics match: Ensure audience aligns with your menu and pricing
- Food vendor limits: Fewer competing vendors increase individual sales potential
- Weather considerations: Outdoor events face cancellation or reduced attendance risks
Revenue Potential Assessment: Festival operations can generate exceptional daily revenue:
- Peak performance: $800-2,000+ daily sales at successful events
- Average festival: $400-800 daily depending on attendance and competition
- Break-even requirements: Factor in event fees, travel costs, and additional staffing
- Menu pricing: Festival customers often accept 20-30% premium pricing
Application and Fee Structure: Festival applications require advance planning:
- Application deadlines: Often 6-12 months before event dates
- Event fees: Range from $200-2,000 depending on event size and exclusivity
- Insurance requirements: Many events require additional coverage or named insured status
- Equipment specifications: Power availability, waste disposal, space limitations vary significantly
Festival Success Strategies
Menu Specialization: Festival menus should emphasize unique and Instagram-worthy items:
- Signature specialties: Items that differentiate from typical festival food
- Visual appeal: Colorful, photogenic presentations encourage social media sharing
- Easy consumption: Hand-held items suitable for walking and standing
- Premium ingredients: Justify higher pricing through quality differentiation
Operational Planning: Festival success requires specialized preparation:
- High-volume capacity: Ability to serve 200-500+ customers during peak hours
- Weather contingency: Tent, weights, and weather protection equipment
- Extended hours: Many festivals operate 10-12 hours requiring staff rotation
- Cash management: Higher cash volume requires secure storage and frequent deposits
Brand Building Opportunity: Festivals provide marketing value beyond immediate sales:
- New customer acquisition: Expose brand to customers from wide geographic area
- Social media content: Festival atmosphere generates engaging content
- Catering leads: Festival success often generates private event inquiries
- Seasonal circuit development: Build relationships with event organizers for recurring opportunities
Pro Tip: Promote your location on social media leading up to the event to draw a crowd. Pre-event marketing can increase sales by 25-40%.
Location Analysis and Traffic Studies
Systematic location analysis eliminates guesswork and provides data-driven insights for location investment decisions. Professional analysis prevents costly mistakes while identifying the most profitable opportunities.
Traffic Study Methodology
Data Collection Procedures: Accurate traffic studies require systematic approaches:
- Observation periods: Count pedestrians during 15-minute intervals for statistical accuracy
- Multiple time slots: Cover different times of day, days of week, and weather conditions
- Duration requirements: Minimum 3 days of observation per location for reliable baseline
- Weather documentation: Record conditions as weather affects foot traffic by 20-50%
- Special circumstances: Note events, construction, or unusual factors affecting normal patterns
Traffic Counting Tools and Techniques:
- Manual counting: Most accurate for food cart analysis but labor-intensive
- Digital counters: $50-200 devices provide consistent counting but miss behavioral insights
- Professional services: $500-2,000 for comprehensive studies with detailed analysis
- Mobile apps: Free smartphone apps adequate for basic counting needs
Data Analysis Framework: Raw traffic counts become meaningful through systematic analysis:
- Peak hour identification: Determine highest traffic periods for operational planning
- Customer demographic observation: Note age, income indicators, group sizes, walking speed
- Seasonal adjustment: Factor weather and seasonal variations into projections
- Competition impact: Observe how existing food options affect pedestrian behavior
Revenue Projection Modeling
Conversion Rate Estimation: Different location types have predictable conversion rate ranges:
- Business districts: 2-4% conversion during lunch hours
- Tourist areas: 3-6% conversion with higher rates during pleasant weather
- College campuses: 4-8% conversion with students showing higher trial rates
- Transit hubs: 3-5% conversion limited by time constraints
- Special events: 6-15% conversion in celebratory atmospheres
Revenue Calculation Formula:
Daily Revenue = (Hourly Traffic × Operating Hours × Conversion Rate × Average Transaction) – Daily Costs
Example Calculation:
- Location traffic: 200 pedestrians/hour
- Operating hours: 5 hours daily
- Conversion rate: 4%
- Average transaction: $9.50
- Daily costs: $120 (permits, fuel, supplies, allocated labor)
- Projected daily profit: (200 × 5 × 0.04 × $9.50) – $120 = $260
Sensitivity Analysis: Test different scenarios to understand risk and opportunity:
- Conservative scenario: Reduce traffic and conversion estimates by 20%
- Realistic scenario: Use baseline data without adjustments
- Optimistic scenario: Increase estimates by 15% for peak conditions
- Weather impact: Model 30% reduction for poor weather days
Demographic Research for Location Success
Understanding potential customers enables menu optimization, pricing strategies, and marketing approaches that maximize location profitability.
Customer Demographics Analysis
Income and Spending Power: Economic indicators help predict pricing tolerance and purchase frequency:
- Median household income: Use Census data for surrounding zip codes
- Employment centers: Research major employers within walking distance
- Disposable income indicators: Observe clothing, vehicles, electronic devices, spending behavior
- Price sensitivity testing: Monitor customer reactions to different price points
Age and Lifestyle Patterns: Different age groups have distinct food preferences and spending patterns:
- Millennials and Gen Z (22-40): Adventurous eaters, social media users, convenience-focused
- Gen X (41-55): Quality-focused, health-conscious, willing to pay premium for superior ingredients
- Baby Boomers (56+): Traditional preferences, value-conscious, relationship-focused
- Mixed demographics: Require diverse menu options to appeal to multiple segments
Cultural and Dietary Considerations: Local demographics influence menu success:
- Ethnic composition: Opportunity for authentic ethnic cuisines or fusion concepts
- Health consciousness: Areas with gyms, yoga studios, health food stores support healthy options
- Dietary restrictions: Research local preferences for vegan, gluten-free, keto-friendly options
- Religious considerations: Halal, kosher, or vegetarian requirements in certain communities
Economic and Employment Research
Employment Center Analysis: Understanding nearby employment helps predict customer patterns:
- Office workers: Regular schedules, consistent demand, time-sensitive lunch needs
- Healthcare workers: Irregular schedules, shift-based demand, quick service requirements
- Retail employees: Lower average income, price-sensitive, younger demographics
- Construction workers: Hearty appetite, cash payments, early morning and lunch demand
Economic Indicators: Local economic health affects food cart success:
- Unemployment rates: Higher unemployment reduces discretionary food spending
- New construction: Indicates growing employment and foot traffic
- Business openings/closures: Trends indicate area economic trajectory
- Transportation changes: New transit routes or road projects affect pedestrian patterns
Competition Analysis and Market Gaps
Understanding competitive landscape helps identify positioning opportunities and market gaps that create profitable niches.
Direct Competition Assessment
Food Cart and Truck Analysis: Document existing mobile food options within 2-block radius:
- Operating schedules: Identify time gaps when customer demand exceeds supply
- Menu offerings: Note cuisine types, pricing, portion sizes, and popular items
- Service quality: Observe customer satisfaction, wait times, and repeat business indicators
- Location rotation: Track whether competitors use consistent or rotating schedules
Performance Indicators: Assess competitor success through observable metrics:
- Line length: Consistent lines indicate strong customer demand and satisfaction
- Customer demographics: Note whether competitors serve your target customers
- Peak hour capacity: Observe whether competitors can handle demand or customers leave
- Price positioning: Compare pricing strategies and value propositions
Market Gap Identification
Cuisine and Style Opportunities: Identify underserved food categories:
- Ethnic cuisines: Research community demographics for authentic cuisine opportunities
- Dietary restrictions: Vegan, gluten-free, keto options often underserved in many markets
- Price points: Gap analysis between fast food and upscale restaurant pricing
- Service styles: Fast-casual, healthy fast food, or gourmet street food positioning
Timing and Schedule Gaps: Find when customer demand exceeds supply:
- Early morning: Breakfast service often limited in business districts
- Late lunch: Service after 2:00 PM often gaps before dinner options
- Weekend service: Many food carts operate weekdays only, creating weekend opportunities
- Evening and late-night: Post-dinner snacks and late-night dining options
Geographic Gaps: Identify areas with foot traffic but limited food options:
- New development: Recently opened office complexes or residential areas
- Transportation nodes: Transit stops or parking areas without food access
- Entertainment districts: Areas with bars, theaters, or attractions lacking food options
- Institutional areas: Hospitals, government buildings, universities with limited vendor access
Permits and Legal Considerations
Location access depends on successfully navigating permit systems and legal requirements that vary significantly by jurisdiction and location type.
Municipal Permit Requirements
Permit Types and Costs: Different locations require specific permit categories:
- Daily permits: $25-100 per day, flexible but expensive for regular operations
- Monthly permits: $200-800 per month, better for established routes
- Annual permits: $1,000-5,000 annually, most cost-effective for consistent locations
- Special event permits: $100-1,000 per event, required for festivals and temporary locations
Application Process Timeline: Permit approval requires advance planning:
- Research phase: 2-4 weeks to understand all requirements and gather documents
- Application submission: Submit complete applications with all required documentation
- Review period: 2-8 weeks for city review, plan approval, and inspection scheduling
- Final approval: 1-2 weeks for permit issuance after passing inspections
- Total timeline: 6-16 weeks from initial research to operational approval
Compliance Requirements: Ongoing obligations include:
- Regular inspections: Health department inspections 2-4 times annually
- Fee payments: Annual renewals, monthly fees, or daily permit purchases
- Insurance maintenance: Continuous coverage with certificates provided to authorities
- Operational restrictions: Specific hours, locations, and equipment requirements
Private Property Agreements
Property Owner Relations: Private locations require negotiation and formal agreements:
- Decision maker identification: Contact property owners or authorized managers
- Benefit presentation: Emphasize employee convenience, foot traffic generation, revenue sharing
- Professional proposal: Include business licenses, insurance certificates, references, revenue projections
- Contract negotiation: Terms covering location exclusivity, operating schedules, revenue sharing percentages
Agreement Terms: Key contract elements protect both parties:
- Location specification: Exact operating areas, parking, storage, utility access
- Revenue sharing: Typically 10-20% of gross sales with transparent reporting requirements
- Operating standards: Hours, days, equipment requirements, cleanliness standards
- Termination procedures: Notice periods, performance standards, cause for termination
Insurance and Liability
Required Coverage Types: Food cart operations require comprehensive insurance protection:
- General liability: $1-2 million coverage for customer and property protection
- Product liability: Coverage for food-related illness or injury claims
- Equipment coverage: Protection against theft, damage, or equipment failure
- Commercial auto: Required when using vehicles for cart transport
- Workers compensation: Mandatory when hiring employees
Additional Insured Requirements: Many locations require additional protections:
- Property owners: Must be named as additional insured on liability policies
- Event organizers: Festivals and events require specific coverage extensions
- Municipal entities: Cities may require additional insured status for public property permits
- Increased coverage: Some locations mandate higher coverage limits than standard policies
Multi-Location Strategy
Successful food cart operators typically manage 3-5 locations simultaneously, creating diversified portfolios that maximize revenue while spreading operational risk.
Portfolio Development Strategy
Location Mix Optimization: Structure location portfolio for maximum profitability and risk reduction:
- Anchor location (40-50% of revenue): Highest-performing, most reliable location
- Secondary locations (25-35% each): Consistent performers with different customer bases
- Opportunity locations (10-20%): Testing grounds for new spots or seasonal opportunities
- Geographic diversification: Spread locations across different districts to reduce localized risks
Revenue Distribution Planning: Target balanced revenue streams that don’t over-depend on single locations:
- Weekday focus: Business districts and office complexes for consistent lunch revenue
- Weekend complement: Markets, festivals, and tourist areas for weekend income
- Evening opportunities: Entertainment districts or late-night campus service
- Seasonal alternatives: Indoor locations for winter months in harsh climates
Scheduling and Logistics Management
Weekly Schedule Optimization: Create templates that maximize revenue while managing operational complexity:
- Travel time calculation: Factor setup, breakdown, and transport time between locations
- Peak hour coordination: Align operating hours with each location’s optimal traffic periods
- Staff allocation: Determine single-operator versus multi-person coverage needs
- Inventory distribution: Plan ingredient and supply needs for each location’s customer base
Operational Efficiency: Multi-location success requires systematic approaches:
- Commissary optimization: Batch preparation for multiple locations reduces total prep time
- Equipment standardization: Consistent equipment across locations simplifies maintenance and operation
- Supply chain management: Coordinate inventory and delivery for multiple daily locations
- Communication systems: Real-time coordination for schedule changes, problems, or opportunities
Performance Monitoring Across Locations
Location-Specific Metrics: Track performance indicators for each location individually:
- Revenue per hour: Total sales divided by operating time including setup and breakdown
- Customer acquisition cost: Marketing and promotional expenses relative to new customers gained
- Repeat customer rate: Percentage of customers who return, indicating satisfaction and loyalty
- Profit margin by location: Revenue minus all direct costs including permits, travel, and allocated overhead
Portfolio Optimization: Regular analysis identifies improvement opportunities and reallocation needs:
- Underperforming locations: Set improvement timelines or elimination criteria
- High-performing locations: Consider expanded hours, additional days, or enhanced offerings
- Market changes: Adapt to construction, competition, or demographic changes
- Seasonal adjustments: Modify portfolio mix based on weather and seasonal customer patterns
Ready to learn more about operating in multiple locations? View our complete Food Cart Multi-location Strategy Guide.
Common Location Mistakes to Avoid
Learning from typical location errors saves time, money, and prevents business failure from poor location decisions.
Research and Analysis Errors
Insufficient Traffic Analysis: Many operators choose locations based on casual observation rather than systematic study:
- Consequence: Revenue projections 30-50% higher than reality, leading to cash flow problems
- Prevention: Conduct minimum 3-day traffic studies during different weather and time conditions
- Cost of mistake: $3,000-10,000 in lost revenue and permit fees before problem identification
Ignoring Competition Impact: Failing to research existing food options leads to market saturation:
- Consequence: Customer base smaller than projected due to established competitors
- Prevention: Map all food options within 3-block radius and identify differentiation opportunities
- Cost of mistake: 40-60% reduction in expected customer volume and conversion rates
Demographic Misalignment: Misunderstanding customer base results in poor menu and pricing decisions:
- Consequence: Low conversion rates despite adequate foot traffic
- Prevention: Research local demographics through Census data and direct observation
- Cost of mistake: Menu redesign costs plus lost sales during adjustment period
Legal and Compliance Issues
Permit Requirement Oversights: Operating without proper permits results in immediate shutdown:
- Consequence: Fines ranging from $500-5,000 plus permit revocation affecting future applications
- Prevention: Research all applicable permits at city, county, and state levels before investment
- Cost of mistake: Legal fees, fines, lost revenue, and potential equipment confiscation
Zoning Violation Problems: Operating in areas not zoned for commercial food service:
- Consequence: Permanent ban from location plus fines and legal complications
- Prevention: Verify zoning compliance through municipal planning departments
- Cost of mistake: Lost location investment plus legal costs and reputation damage
Insurance Coverage Gaps: Inadequate insurance creates liability exposure and permit violations:
- Consequence: Personal financial exposure plus potential permit revocation
- Prevention: Work with commercial insurance agents familiar with food cart requirements
- Cost of mistake: Unlimited liability exposure plus operational shutdown costs
Financial Planning Mistakes
Revenue Overestimation: Unrealistic sales projections create cash flow crises:
- Consequence: Inability to cover expenses during slower-than-expected startup period
- Prevention: Use conservative projections with 20% safety margin for unexpected challenges
- Cost of mistake: Business failure or emergency funding needs at unfavorable terms
Hidden Cost Underestimation: Failing to account for all location-related expenses:
- Consequence: Locations appear profitable but actually lose money after all costs
- Prevention: Calculate total cost including permits, fuel, parking, revenue sharing, and allocated overhead
- Cost of mistake: Continued operation at unprofitable locations drains business resources
Seasonal Planning Failure: Not preparing for predictable seasonal revenue fluctuations:
- Consequence: Cash flow crises during slow seasons when tourism or student populations decline
- Prevention: Research seasonal patterns and maintain cash reserves equal to 3-6 months operating expenses
- Cost of mistake: Emergency borrowing or business closure during seasonal downturns
Maximize Your Success: Choosing the Right Cart for the Right Spot
Selecting the right location is only half the battle. Your cart needs to be equipped to handle the specific challenges and demands of each environment.
Location-Specific Cart Requirements
Office Park Optimization: Focus on efficiency and professional appearance:
- Compact design: Navigate tight parking areas and professional environments
- Coffee capability: High-quality espresso machines and beverage equipment
- Quick service setup: Equipment layout that enables 2-3 minute service times
- Professional aesthetics: Clean, modern appearance that fits business environments
Transit Hub Mobility: Prioritize portability and grab-and-go efficiency:
- Easy setup/breakdown: Quick assembly for locations with time restrictions
- Secure storage: Lockable compartments for high-security environments
- Grab-and-go focus: Refrigerated display cases and pre-packaged options
- Payment speed: Advanced POS systems for rapid transaction processing
Sports Venue Capacity: Invest in high-volume equipment for crowd surges:
- Large cooking surfaces: Multiple grills, fryers, or cooking stations
- High-capacity storage: Ingredient and supply storage for 500+ customers
- Crowd management: Efficient ordering and pickup systems for large groups
- Weather protection: Canopies and equipment protection for outdoor venues
Street Vending Visibility: Maximize visual impact and brand recognition:
- Eye-catching design: Bright colors, clear signage, and attractive branding
- Menu visibility: Large, readable menu boards visible from 20+ feet
- Weather adaptability: Equipment protection and customer comfort features
- Security features: Locking mechanisms and theft prevention systems
Cart Customization for Success
Equipment Selection by Menu Type: Match equipment capabilities to location-specific menu needs:
- Breakfast locations: Griddles, coffee equipment, pastry display cases
- Lunch destinations: Fryers, grills, refrigerated prep areas, salad stations
- Snack and beverage focus: Ice machines, blenders, heated holding units
- Specialty items: Custom equipment for unique menu offerings like crepes, smoothies, or ethnic specialties
Technology Integration: Modern cart success requires technology adoption:
- POS systems: Cloud-based systems for real-time sales tracking and inventory management
- Mobile payment: Contactless payment options including phones, cards, and wearables
- Social media integration: Live location updates and customer engagement tools
- Loyalty programs: Digital punch cards and reward systems for repeat customers
Branding and Marketing Elements: Cart design should reinforce brand identity:
- Consistent color schemes: Recognizable branding across all locations and materials
- Social media worthy: Instagram-friendly design elements that encourage customer photos
- Local customization: Adapt branding elements to specific location demographics
- Professional appearance: Quality construction and finishing that builds customer confidence
Investment Planning and ROI
Cart Investment by Location Type: Budget appropriately for location-specific needs:
- Basic setup ($15,000-30,000): Simple menus, single locations, standard equipment
- Professional operation ($30,000-60,000): Multi-location capability, advanced equipment, professional branding
- High-volume capacity ($60,000-100,000): Sports venues, festivals, multiple simultaneous locations
Return on Investment Timeline: Realistic expectations for cart investment recovery:
- Year 1: Break-even to 10% profit margin while establishing customer base
- Year 2: 15-20% profit margin with optimized operations and customer loyalty
- Year 3: 20-25% profit margin with potential expansion opportunities
- Cart payback period: Typically 18-36 months depending on location performance and operational efficiency
Wrapping It Up
Finding the perfect location for your food cart business requires combining systematic analysis with operational excellence. The most successful operators understand that location success depends on matching customer demographics with menu offerings while maintaining efficient operations and professional service standards.
Key Success Principles
Data-Driven Location Selection: Use traffic studies, demographic research, and financial analysis rather than intuition to choose locations. Systematic analysis prevents costly mistakes while identifying the most profitable opportunities.
Customer-Focused Operations: Understand your target customers’ needs, preferences, and constraints. Office workers need speed, students want value, tourists seek experiences, and event-goers celebrate with food.
Operational Excellence: Consistent quality, efficient service, and professional presentation create customer loyalty that transforms good locations into great revenue generators.
Strategic Portfolio Development: Successful operators build diversified location portfolios that balance risk while maximizing revenue opportunities across different customer segments and time periods.
Your Location Success Action Plan
Start with one well-researched location that matches your menu, budget, and operational capabilities. Perfect your operations, build customer relationships, and establish profitable systems before expanding to additional locations.
Conduct thorough analysis including traffic studies, demographic research, competition assessment, and permit requirements before making location commitments. Invest time in preparation to avoid expensive mistakes and operational challenges.
Focus on building systems and procedures that scale efficiently. Document successful approaches, standardize operations, and create frameworks that enable expansion when opportunities arise.
Most importantly, remember that great locations become exceptional through excellent operations. Customer service, food quality, and operational consistency turn foot traffic into loyal customers and sustainable profitability.
Ready to find the perfect location and cart for your food business? The right spot combined with operational excellence can transform your cart into a local favorite and drive consistent sales growth.
At Cart-King International, we’ve spent over 20 years helping food entrepreneurs succeed by creating carts tailored to every location and business model. Whether you need a compact setup for tight urban streets or a high-capacity cart for stadium crowds, we can help you with an excellent selection of food carts designed for your specific location requirements.
Contact us today to explore your options and get started on building your food cart business. Call us at 1-877-986-7771 and let’s find the perfect location strategy and equipment for your success. With proper location selection and the right cart setup, your mobile food business can become a profitable local destination that customers seek out and recommend to others.
What you can read next

